Why One Signal Number Is Not Enough
A user normally asks a simple question: will the connection be reliable and fast? A radio reports several measurements because received power, reference-signal power, noise, and interference describe different parts of the answer.
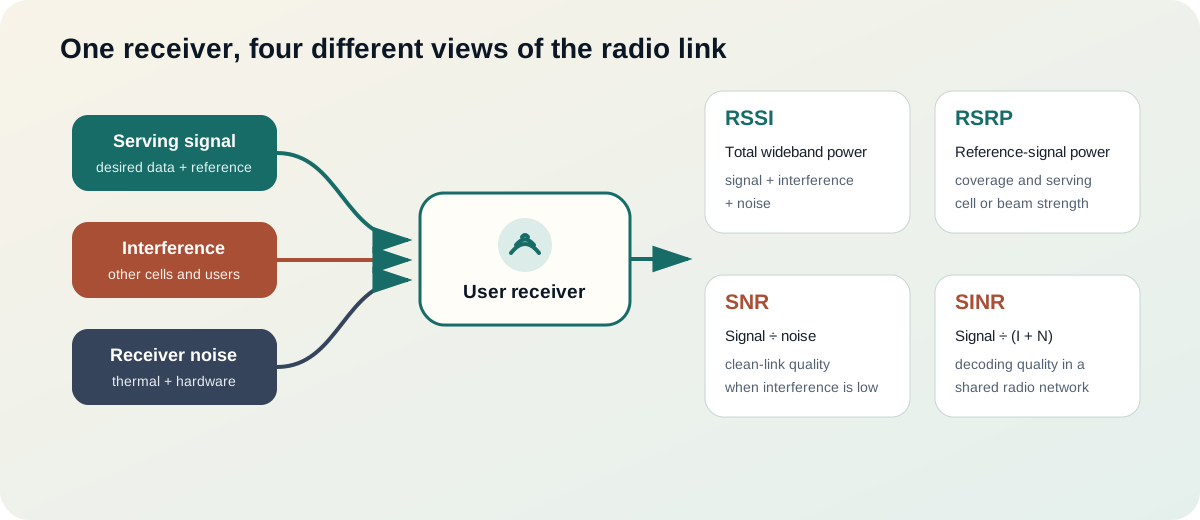
The exact measurement procedure and averaging window depend on the radio technology, frequency band, bandwidth, device, and network configuration. Values from two different systems should therefore be compared only when their definitions and conditions match.
References for this section3
- 3GPP, TS 38.215: NR; Physical layer measurements.
- ETSI, TS 138 215 V18.4.0: 5G; NR; Physical layer measurements, Release 18, 2025.
- 3GPP, TS 36.214: E-UTRA; Physical layer measurements.
RSSI: Total Received Power
Received Signal Strength Indicator (RSSI) is a broad received-power measurement. Depending on the technology, it can include the desired transmission, other users, neighbouring cells, interference, and thermal noise within the receiver's measurement bandwidth:
The powers must be added in linear units such as watts or milliwatts, not directly in dBm. A more negative dBm value represents less power: dBm is stronger than dBm.
RSSI is useful for detecting whether substantial RF energy is present. It is not, by itself, a clean measure of the serving signal. A congested channel can produce a relatively strong RSSI because interference is also power.
References for this section3
- 3GPP, TS 38.215: NR; Physical layer measurements.
- ETSI, TS 138 215 V18.4.0: 5G; NR; Physical layer measurements, Release 18, 2025.
- 3GPP, TS 36.214: E-UTRA; Physical layer measurements.
RSRP: Reference-Signal Power
Reference Signal Received Power (RSRP) measures the average received power of defined cellular reference-signal resource elements. It focuses on a known signal from a cell or beam rather than all energy across the channel.
If reference-signal resource elements are included, a conceptual linear-power average is
RSRP is widely used for coverage assessment, cell selection, reselection, and handover decisions. In 5G NR, measurements may be associated with synchronization-signal blocks or CSI reference signals, so different beams from the same site can have different reported values.
References for this section3
- 3GPP, TS 38.215: NR; Physical layer measurements.
- ETSI, TS 138 215 V18.4.0: 5G; NR; Physical layer measurements, Release 18, 2025.
- 3GPP, TS 36.214: E-UTRA; Physical layer measurements.
SNR and SINR: Signal Quality
Signal-to-noise ratio (SNR) compares desired signal power with noise power :
Signal-to-interference-plus-noise ratio (SINR) also includes interference power :
SNR is a suitable model when interference is negligible or separately removed. In a frequency-reuse cellular network, SINR is usually closer to the user's real decoding condition. Higher SINR permits denser modulation and stronger effective code rates; low SINR forces a robust modulation and coding scheme or causes retransmissions.
References for this section3
- 3GPP, TS 38.215: NR; Physical layer measurements.
- ETSI, TS 138 215 V18.4.0: 5G; NR; Physical layer measurements, Release 18, 2025.
- 3GPP, TS 36.214: E-UTRA; Physical layer measurements.
RSRQ Connects Reference Power and Wideband Power
Cellular devices may also report Reference Signal Received Quality (RSRQ). In LTE, its basic linear relationship is
where is the number of resource blocks across the measured bandwidth. RSRQ falls when wideband interference or loading raises RSSI without a corresponding rise in serving-cell reference power. NR defines analogous reference-signal quality measurements with measurement-specific details.
References for this section3
- 3GPP, TS 38.215: NR; Physical layer measurements.
- ETSI, TS 138 215 V18.4.0: 5G; NR; Physical layer measurements, Release 18, 2025.
- 3GPP, TS 36.214: E-UTRA; Physical layer measurements.
Reading the Values Together
| Observation | Likely user experience | Engineering interpretation |
|---|---|---|
| Strong RSRP, high SINR | Stable link and high data-rate potential | Strong desired signal with limited disturbance |
| Strong RSRP, low SINR | Signal bars may look good, but speed or latency can disappoint | Interference, heavy reuse, distortion, or congestion may dominate |
| Weak RSRP, acceptable SINR | Link may work at a modest rate but coverage margin is limited | Desired signal is weak yet relatively clean |
| Weak RSRP, low SINR | Drops, retransmissions, low throughput, or no service | Poor coverage and poor decoding conditions |
| Strong RSSI, weak RSRP | Considerable RF energy without a strong serving reference | Interference or energy from other transmitters may be present |
The following ranges are illustrative, not universal acceptance limits. Device vendors and network standards may use different filters, reference signals, and thresholds.
| Metric | Strong / favourable | Usable / mixed | Weak / difficult |
|---|---|---|---|
| RSRP | Above about dBm | About to dBm | Below about dBm |
| SINR | Above about 20 dB | About 5 to 20 dB | Below about 5 dB |
| RSRQ | Above about dB | About to dB | Below about dB |
A negative SINR does not automatically mean that communication is impossible. Robust coding and low-order modulation can decode signals below the combined interference-plus-noise power, although the achievable data rate is limited.
References for this section3
- 3GPP, TS 38.215: NR; Physical layer measurements.
- ETSI, TS 138 215 V18.4.0: 5G; NR; Physical layer measurements, Release 18, 2025.
- 3GPP, TS 36.214: E-UTRA; Physical layer measurements.
Why Signal Bars and Speed Can Disagree
Phone signal bars are vendor-defined summaries, often influenced strongly by coverage measurements such as RSRP. Throughput also depends on:
- SINR and the selected modulation and coding scheme;
- channel bandwidth and carrier aggregation;
- the number of MIMO layers the channel and device can sustain;
- how many users share the scheduler;
- backhaul capacity, core-network load, and server response;
- mobility, blockage, retransmissions, and device thermal limits.
This explains why a user can see strong bars but receive low speed in a crowded venue, or see modest bars yet obtain good performance on a clean, lightly loaded channel.
References for this section3
- 3GPP, TS 38.215: NR; Physical layer measurements.
- ETSI, TS 138 215 V18.4.0: 5G; NR; Physical layer measurements, Release 18, 2025.
- 3GPP, TS 36.214: E-UTRA; Physical layer measurements.
A Practical Diagnostic Order
- Check RSRP to judge serving-signal coverage.
- Check SINR or RSRQ to judge whether the signal is clean enough to use efficiently.
- Check channel bandwidth, MIMO rank, and modulation/coding to estimate radio capacity.
- Compare radio capacity with scheduled throughput to identify congestion or non-radio bottlenecks.
- Observe the values over time and location; a single snapshot can hide fading and mobility effects.
References for this section3
- 3GPP, TS 38.215: NR; Physical layer measurements.
- ETSI, TS 138 215 V18.4.0: 5G; NR; Physical layer measurements, Release 18, 2025.
- 3GPP, TS 36.214: E-UTRA; Physical layer measurements.
Takeaway
RSSI says how much total RF power the receiver observes. RSRP says how strong a selected cellular reference signal is. SNR compares signal with noise, while SINR also accounts for interference. From a user's perspective, coverage and quality must be read together: strong received power creates opportunity, but clean spatial and spectral resources turn that opportunity into reliable throughput.
References for this section3
- 3GPP, TS 38.215: NR; Physical layer measurements.
- ETSI, TS 138 215 V18.4.0: 5G; NR; Physical layer measurements, Release 18, 2025.
- 3GPP, TS 36.214: E-UTRA; Physical layer measurements.
Complete references and further reading
- 3GPP, TS 38.215: NR; Physical layer measurements.
- ETSI, TS 138 215 V18.4.0: 5G; NR; Physical layer measurements, Release 18, 2025.
- 3GPP, TS 36.214: E-UTRA; Physical layer measurements.