Start With a Physical Wave
An antenna receives one rapidly changing voltage. The receiver shifts the wanted band to baseband and records it as two coordinates:
- I (in-phase): one axis of the complex signal.
- Q (quadrature): the axis 90 degrees from I.
- Physical meaning: together they retain amplitude and phase; they are not two independent radio waves.
- : complex baseband sample at sample index .
- , : measured in-phase and quadrature coordinates.
- : imaginary unit; it labels the perpendicular Q axis.
For a simple complex tone,
- : tone amplitude; larger makes a larger I/Q circle.
- : baseband tone frequency in hertz.
- : sample rate in samples per second; is the sample index.
- : starting phase in radians; is the imaginary unit.
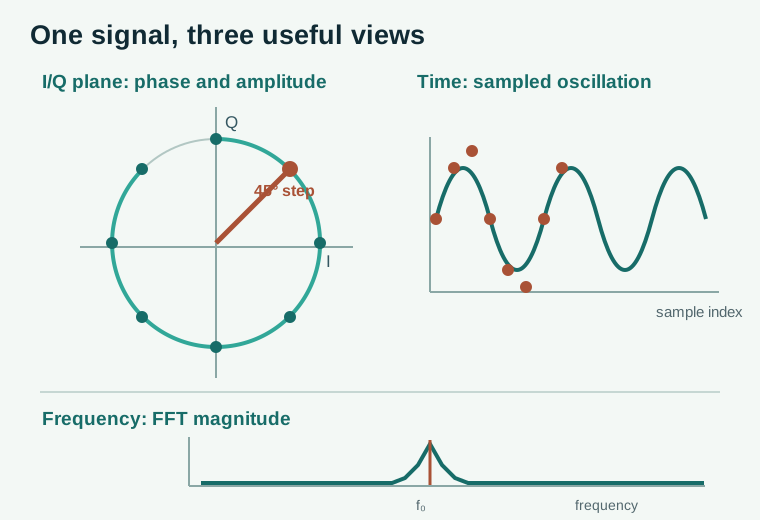
- Read the plot: radius tracks amplitude; angle tracks phase. One plot alone cannot identify why either changed.
References for this section2
- MathWorks, OFDM Resource Grid and Channel Estimation.
- MathWorks, Communications Toolbox Test and Measurement.
Sampling: What Can Be Preserved?
- Sampling: recording a waveform at regular time intervals.
- Aliasing: different input frequencies appear identical after sampling too slowly.
- Anti-alias filter: removes unwanted out-of-band energy before analogue-to-digital conversion.
- Always state: occupied bandwidth, filtering, and whether samples are real or complex.
For a real low-pass signal with highest frequency :
- : sample rate in samples per second.
- : highest input frequency in hertz for this real low-pass case.
- Complex baseband: a suitably filtered band of width can use a rate around under the stated convention; filter transition margin and frequency placement still matter.
References for this section2
- MathWorks, OFDM Resource Grid and Channel Estimation.
- MathWorks, Communications Toolbox Test and Measurement.
Worked Example: A Tone in Three Views
Take a 1 MHz baseband tone sampled at 8 million complex samples per second:
- I/Q rotation: phase advances , or 45 degrees, per sample. Eight samples complete one turn.
- FFT view: with samples, the spacing between plotted frequency bins is
- : spacing between FFT frequency bins.
- : sample rate; here 8 million complex samples/s.
- : number of measured samples in the transform; here 1024.
- Important: bin spacing is not automatically the ability to resolve two nearby tones. Window, observation time, and SNR also matter; zero-padding adds no measured time.
| Idea | Physical meaning | Where it helps |
|---|---|---|
| Sample rate | How often the receiver records the waveform | Preserving the desired bandwidth and setting processing cost |
| I/Q amplitude and phase | Instantaneous complex position of the baseband signal | Modulation, channel estimation, and beamforming |
| Frequency spectrum | How signal energy is distributed across frequency | Detecting occupied band, interference, and filtering needs |
| Filter response | Frequencies passed, attenuated, or delayed by a system | Rejecting unwanted energy without damaging the wanted waveform |
References for this section2
- MathWorks, OFDM Resource Grid and Channel Estimation.
- MathWorks, Communications Toolbox Test and Measurement.
FFT: Another View of the Same Samples
-
DFT: turns one finite block of time samples into complex frequency bins.
-
FFT: an efficient algorithm for computing that transform.
-
Spectrum peak: may be a wanted tone or interference; read it with sample rate, window, duration, and normalization.
-
Useful filtering: removes out-of-band noise or interference.
-
Too narrow: cuts away part of the wanted waveform.
-
Group delay: a filter can also distort timing; compare spectra before and after at the same reference level.
The DFT of a block is
- : complex value of frequency bin ; its magnitude and phase both matter.
- : input sample ; : number of samples.
- , : time-sample and frequency-bin indices; is the imaginary unit.
- Leakage: a finite observation spreads a non-bin-centred tone across bins; a window can reduce sidelobes but widens the main lobe.
References for this section2
- MathWorks, OFDM Resource Grid and Channel Estimation.
- MathWorks, Communications Toolbox Test and Measurement.
Application: Debug an SDR Capture
If an SDR constellation looks rotated or spread:
- Verify RF centre frequency, gain, sample rate, and clipping.
- Inspect the spectrum for frequency offset or adjacent interference.
- Inspect phase over time: steady rotation suggests carrier offset; irregular motion can indicate phase noise or a changing channel.
- Only then judge the equalizer or decoder.
- Keep complex I/Q: power alone discards phase needed for delay estimation, beamforming, and localization.
- Record metadata: sample rate, calibration, time reference, and antenna position.
References for this section2
- MathWorks, OFDM Resource Grid and Channel Estimation.
- MathWorks, Communications Toolbox Test and Measurement.
What to Check in an Experiment
- Confirm sample rate, centre frequency, gain setting, and whether samples are real or complex.
- Inspect the time-domain envelope for clipping, dropouts, and burst timing.
- Inspect the spectrum for occupied bandwidth, spurs, and interfering energy.
- Check I/Q balance and constellation shape before interpreting a channel estimate.
- Next in the receiver: OFDM and receiver processing.
- Physical background: spectrum, frequency, and bandwidth.
References for this section2
- MathWorks, OFDM Resource Grid and Channel Estimation.
- MathWorks, Communications Toolbox Test and Measurement.
Complete references and further reading
- MathWorks, OFDM Resource Grid and Channel Estimation.
- MathWorks, Communications Toolbox Test and Measurement.