Define the Question Before the Metric
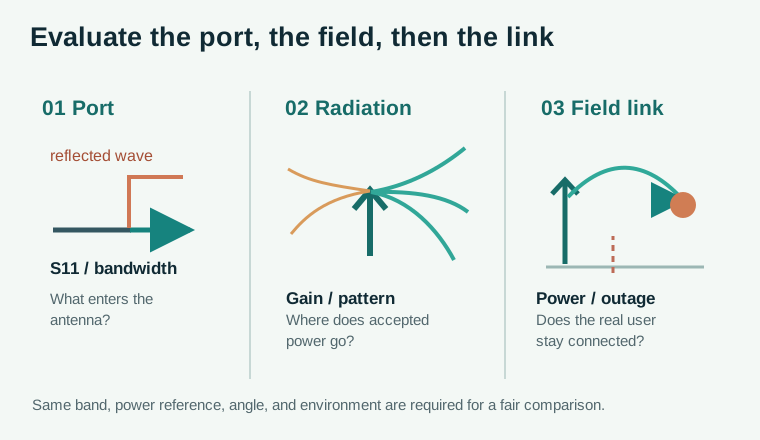
Start with one question: is the feed matched, is power radiated in the right direction, or does the deployed link actually work?
- Port test: measures what reflects at the antenna feed.
- Radiation test: measures efficiency, pattern, gain, and polarization.
- Field test: measures received power and service under real paths and interference.
- Fair comparison: record frequency, bandwidth, polarization, port, angle, distance, environment, and measurement method.
References for this section3
Antenna Evaluation
| Parameter | Physical meaning | Use it when | Do not infer |
|---|---|---|---|
| / impedance bandwidth | Reflection at a specified feed reference | Checking usable matching across frequency | Good radiation or coverage from matching alone |
| Radiation efficiency | Fraction of accepted power actually radiated | Comparing loss in antenna designs | Beam direction from efficiency alone |
| Realized gain and pattern | Useful radiation in each direction including mismatch | Link-budget and coverage evaluation | Whole-area quality from only peak gain |
| HPBW and sidelobe level | Main-lobe width and unintended directional peaks | Planning pointing and interference | A full 3D pattern from a single 2D cut |
| Cross-polarization and port isolation | Unwanted orthogonal field or coupling between ports | Dual-polarized antennas and arrays | Independent MIMO streams without checking the channel |
- Directivity: directional concentration without loss.
- Gain: includes radiation efficiency.
- Realized gain: also includes feed mismatch. Compare values only with the same definition and reference.
References for this section3
A Measurement Plan, Not a Single Number
-
Feed port: calibrate the vector network analyser and measure across the band.
-
Interpretation: dB corresponds to roughly 10% reflected power; it does not measure radiation efficiency.
-
Decision: choose a matching threshold from the link requirement, not from a universal pass/fail rule.
-
Radiation stage: measure co- and cross-polar patterns, realized gain, HPBW, sidelobes, and efficiency.
-
Array scan: repeat away from boresight; steered gain can fall while sidelobes grow.
-
Comparison: use identical angular cuts and power normalization.
-
Multiport isolation: tells how much one port couples into another.
-
MIMO check: also test channel correlation, receive SNR, and independent spatial paths. Isolation alone does not prove two usable streams.
References for this section3
Channel and Link Evaluation
| Parameter | Physical meaning | Use it when |
|---|---|---|
| EIRP and received power | Radiated budget in a direction and power at the receiver | Checking coverage and regulatory or hardware constraints |
| Path loss and shadowing margin | Average attenuation and slower obstruction variation | Siting and coverage prediction |
| PDP and RMS delay spread | Relative strength and time separation of received paths | Assessing frequency selectivity and equalization needs |
| Doppler spread | Speed of channel variation | Choosing channel-tracking and pilot update rates |
| SINR / outage probability | Quality relative to interference and noise; fraction of cases below a criterion | Evaluating robust service, not just average coverage |
The basic power budget is
- , : received and transmit power in dBm.
- , : transmit and receive directional gain in dBi.
- , , : feed, propagation, and remaining losses in dB.
- Avoid double-counting: EIRP already includes transmit-side gain and relevant preceding losses. State whether receive gain is peak, realized, or measured toward the user.
References for this section3
Worked Example: Average Looks Fine, Edge Fails
Take an illustrative 30 dBm EIRP link with 14 dBi receive gain, 110 dB path loss, 3 dB other loss, and dBm receiver sensitivity:
- Clear path: dBm; nominal margin is 11 dB.
- Obstructed path: another 15 dB loss gives dBm; margin becomes dB.
- Evaluation: report the fraction of user locations below the service threshold, not only the healthy-looking average.
Sensitivity and loss values here are example inputs, not universal requirements.
References for this section3
Application: Compare Two Antenna Designs Fairly
Compare Design A (narrow, high peak gain) with Design B (broad, lower peak gain):
- Keep transmit power, frequency, mounting height, and receiver positions the same.
- Measure received power and SINR on the same spatial grid.
- Report a coverage percentile or outage fraction, not only peak gain.
- Include beam-tracking overhead for moving users. A may win point-to-point while B covers more people.
- RIS experiment: record the no-RIS baseline, tested states, positions, and channel realizations.
- Fairness: a peak selected from many RIS states is not directly comparable with one baseline measurement.
- Report: selection procedure and distribution of gains.
References for this section3
A Repeatable Evaluation Order
- Fix the scenario: operating band, bandwidth, link distance, orientation, traffic or interference, and target service.
- Check the antenna port and radiation properties separately: matching, efficiency, pattern, and polarization.
- Build a link budget with explicit gains and losses; note whether gain already includes mismatch.
- Test representative LOS, blocked, and mobile channel conditions rather than reporting only one favourable point.
- Report distributions or worst-case margins alongside averages, and state the threshold used for outage.
- Cellular measurements: RSRP, RSSI, SNR, SINR, and CQI.
- Array design: geometry and phased arrays.
- Decision rule: no universal optimal number; compare against a stated service target and test condition.